Émissions de CO₂ en Europe
Choroplèthe éditoriale : annotations par pays, flèche déportée pour un micro-état, légende par classes.
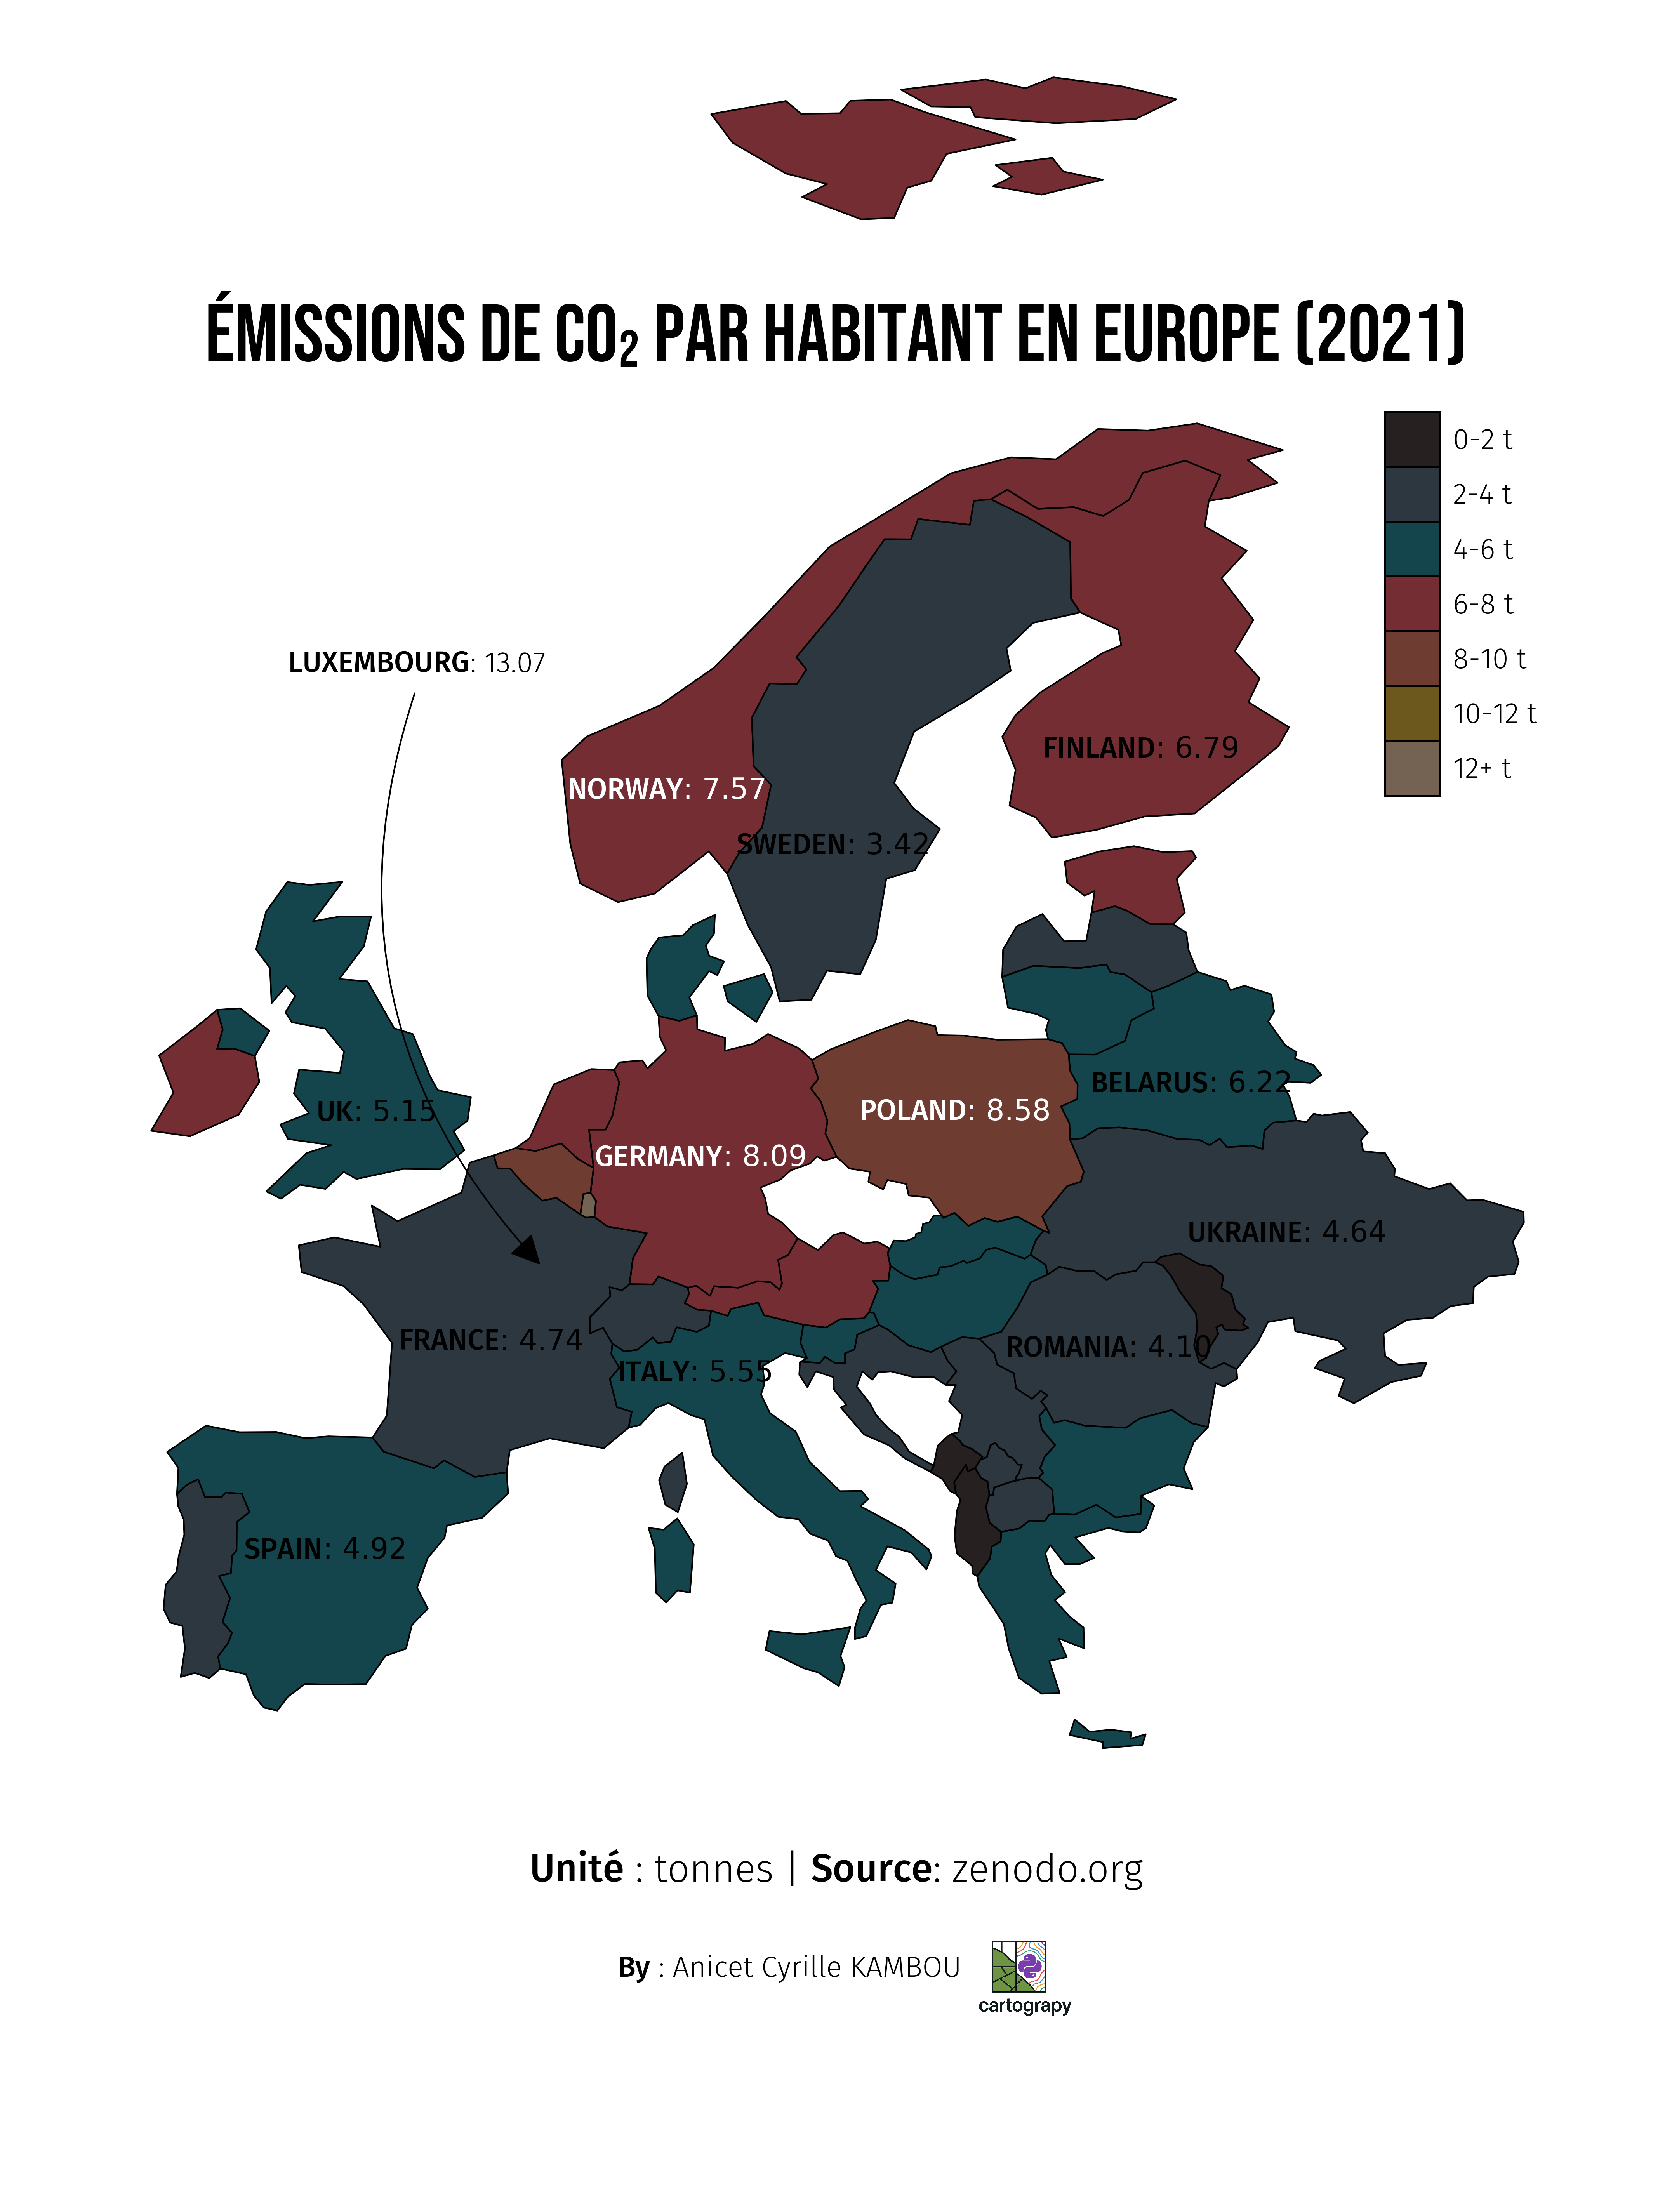
Carte éditoriale (émissions de CO₂ par habitant en Europe, 2021), inspirée d’un exemple de The Python Graph Gallery, entièrement reconstruite avec Map : sans matplotlib/highlight_text/drawarrow importés directement dans le script. Le détail pas-à-pas de chaque bloc est dans le guide Cartes statiques ; cette page donne le code complet, prêt à copier-coller.
Techniques utilisées :
add_polygons_choropleth()pour la coloration par valeuradd_custom_text(..., to="ax")pour les étiquettes pays, avec segments<mis en évidence>en grasadd_fig_arrow()+add_custom_text(..., to="fig")pour décaler l’étiquette d’un micro-état (Luxembourg) hors de son polygoneadd_swatch_legend()pour une légende à classes manuellesadd_custom_text(..., to="fig")+add_image()pour le titre, le sous-titre et le logo, indépendants du zoom de la carte
import pandas as pd
import cartograpy as cp

# --- Données ---
world = cp.load(
    "https://raw.githubusercontent.com/holtzy/the-python-graph-gallery/"
    "master/static/data/europe.geojson"
)
df = cp.load(
    "https://raw.githubusercontent.com/holtzy/the-python-graph-gallery/"
    "master/static/data/co2PerCapita.csv"
)
df["Year"] = pd.to_numeric(df["Year"], errors="coerce")
df["Total"] = pd.to_numeric(df["Total"], errors="coerce")

data = world.merge(df, how="left", left_on="name", right_on="Country")
data = data.query(
    'continent == "Europe" and name not in ["Russia", "Iceland"] and Year == 2021'
)
data = data[["name", "Total", "geometry"]].dropna(subset=["Total", "geometry"]).copy()

proj = data.to_crs(epsg=3035)
data["centroid"] = proj.geometry.centroid.to_crs(data.crs)

# --- Polices ---
my_cmap = "Acanthostracion_polygonius"
font_title = cp.google_font("Bebas Neue")
font_text = cp.google_font("Fira Sans", weight="light")
font_bold = cp.google_font("Fira Sans", weight="medium")

text_color = "black"
background_color = "white"

# --- Carte de base ---
m = cp.Map(figsize=(10, 10), dpi=400, basemap=False, title="")
m.set_background_color(background_color)
m.add_polygons_choropleth(
    data,
    column_to_plot="Total",
    cmap=my_cmap,
    edge_color="black",
    linewidth=0.5,
    show_labels=True,
    show_colorbar=False,
)
m.set_extent([-11, 40, 30, 75])
m.hide_gridline()

# --- Annotations par pays ---
adjustments = {
    "France": (10, 3), "Italy": (-2.4, 2.5), "Finland": (0, -2),
    "Belarus": (0, -0.4), "Ireland": (0, -1), "Germany": (-0.2, 0),
    "Poland": (0, 0.2), "Sweden": (-1.2, -2.8),
    "United Kingdom": (1, -1.5), "Norway": (-4, -5.5),
}
countries_to_annotate = [
    "France", "Italy", "Romania", "Poland", "Finland", "Ukraine",
    "Spain", "Germany", "Sweden", "United Kingdom", "Belarus", "Norway",
]

data_by_country = data.set_index("name")

for country in countries_to_annotate:
    if country not in data_by_country.index:
        continue
    row = data_by_country.loc[country]
    dx, dy = adjustments.get(country, (0, 0))
    x, y = row["centroid"].x + dx, row["centroid"].y + dy
    rate = row["Total"]
    label = "UK" if country == "United Kingdom" else country

    m.add_custom_text(
        f"<{label.upper()}>: {rate:.2f}", (x, y), to="ax",
        fontsize=9, color="white" if rate < 6 else text_color,
        ha="center", va="center",
        highlight_textprops=[{"font": font_bold}],
    )

# --- Cas du Luxembourg (trop petit pour une étiquette directe) ---
lux = data[data["name"] == "Luxembourg"]
if not lux.empty:
    lux_value = lux.iloc[0]["Total"]

    # position figure de la flèche calculée depuis le centroïde du pays
    # (transData -> transFigure), plutôt qu'une valeur fixe : reste correcte
    # si l'étendue ou la taille de la figure change
    m.fig.canvas.draw()
    lux_point = lux.iloc[0]["centroid"]
    head_x, head_y = m.ax.transData.transform((lux_point.x, lux_point.y))
    head_position = tuple(m.fig.transFigure.inverted().transform((head_x, head_y)))

    m.add_fig_arrow(
        tail_position=(0.32, 0.70),
        head_position=(head_position[0] - 0.01, head_position[1] + 0.01),
        radius=0.3,
        width=0.5, head_width=4, head_length=8, color="black",
    )
    m.add_custom_text(
        f"<LUXEMBOURG>: {lux_value:.2f}", (0.32, 0.71), to="fig",
        highlight_textprops=[{"font": font_bold}],
        color=text_color, fontsize=9, font=font_text,
        ha="center", va="center",
    )

# --- Légende par classes ---
value_ranges = [0, 2, 4, 6, 8, 10, 12, 15]
labels = ["0-2 t", "2-4 t", "4-6 t", "6-8 t", "8-10 t", "10-12 t", "12+ t"]
cmap_obj = cp.load_cmap(my_cmap)

items = [
    (lab, cmap_obj((value_ranges[i] + value_ranges[i + 1]) / 2 / value_ranges[-1]))
    for i, lab in enumerate(labels)
]
m.add_swatch_legend(
    items, xy=(35, 70),
    rect_width=2, rect_height=1.5, y_step=1.5,
    fontsize=9, color=text_color,
    edge_color="black", linewidth=0.6,
    font=font_text,
)

# --- Titre, sous-titre, signature, logo ---
m.add_custom_text(
    "Émissions de CO₂ par habitant en Europe (2021)", (0.5, 0.87), to="fig",
    color=text_color, fontsize=25, font=font_title,
    ha="center", va="top",
)
m.add_custom_text(
    "<Unité> : tonnes | <Source>: zenodo.org", (0.5, 0.2), to="fig",
    color=text_color, fontsize=12, font=font_text,
    ha="center", va="top",
    highlight_textprops=[{"font": font_bold}, {"font": font_bold}],
)
m.add_custom_text(
    "<By> : Anicet Cyrille KAMBOU", (0.48, 0.15), to="fig",
    color=text_color, fontsize=9, font=font_text,
    ha="center", va="center",
    highlight_textprops=[{"font": font_bold}],
)
m.add_image("assets/img/logo.png", (0.44, 0.14), zoom=0.035)

m.save("co2-europe.png", dpi=600)